Cooperative Thinking Strategies Research
Cooperative Thinking Strategies Research Resources
Overview
The BUILD Strategy is used by cooperative groups to resolve a two-sided issue. The research was conducted in 24 fourth- and fifth-grade general education classes. These intact classes were randomly assigned to the experimental or control condition. A total of 493 students participated. Twelve teachers of the experimental classes taught their students the SCORE Skills and the BUILD Strategy. The twelve control class teachers did not teach the SCORE Skills or the BUILD Strategy to their students.
Results
Observational data were gathered on the fidelity of the experimental teachers’ implementation of the instruction. They presented a mean of 86% of the information on the SCORE Skills and 89% of the information on the BUILD Strategy, according to a checklist based on the two instructor’s manuals.
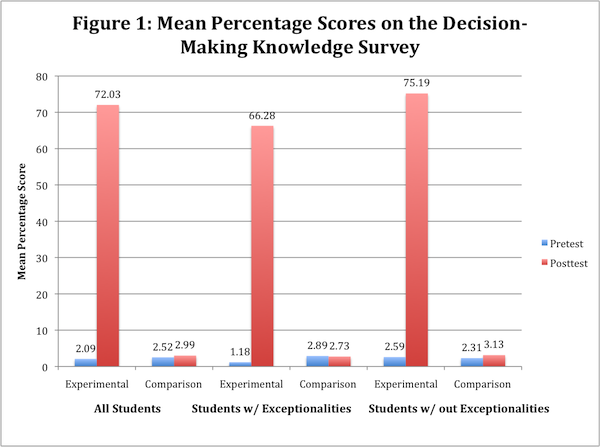
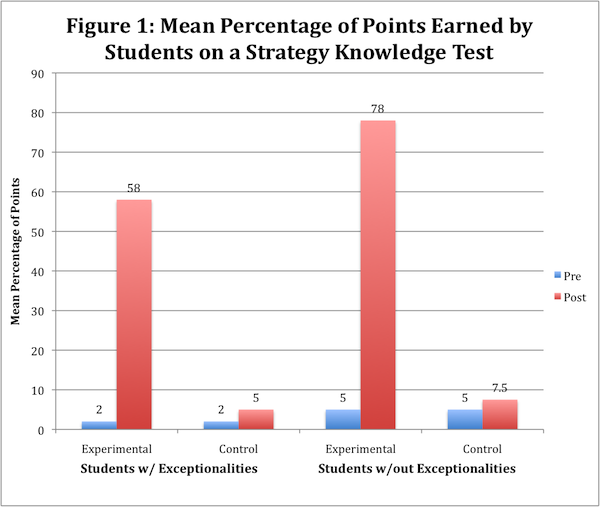
All students in experimental and control classes completed a written test of their knowledge about social and decision-making skills at pretest and posttest. The ANCOVAs revealed significant differences between the posttest scores of experimental and control students for students with exceptionalities, F (1, 23) = 94.80, p < .001, η2 = .82, and for students without exceptionalities, F (1, 22) = 265.83, p < .001, η2 = .93. (These are very large effect sizes.) For students with and without exceptionalities, the adjusted mean for the experimental group was significantly larger than the adjusted mean for the control group. (See Figure 1 for mean scores.)
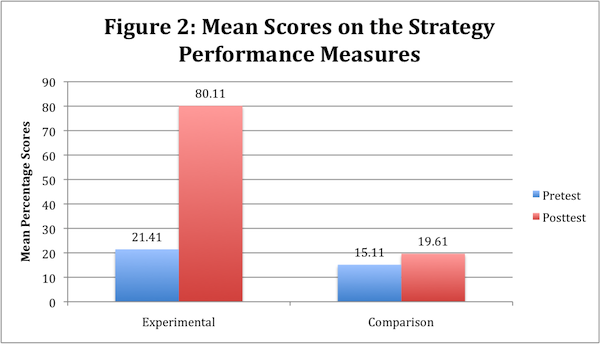
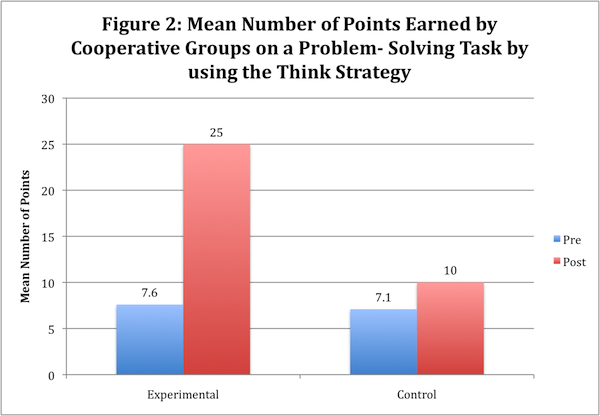
Data were also gathered on the students’ performance as they resolved two-sided issues in small groups during the pretest and posttest. Since students with and without exceptionalities worked together in these groups, analyses were conducted on the combined group means. Observers determined the percentage of strategy steps the students used. The ANCOVA revealed a significant difference between the experimental and control group posttest scores, F (1, 23) = 68.53, p < .001, η2 = .77, representing a very large effect size. The adjusted posttest mean for the experimental group was significantly larger than the adjusted posttest mean for the control group. (See Figure 2.)
Experimental teachers and students used a 7-point Likert-type scale to rate items regarding their satisfaction with the program (“7” indicating “extremely satisfied”; “1” indicating “extremely dissatisfied”) at the end of the year. Teachers endorsed the program, and their ratings indicated satisfaction with each aspect of the program. For example, teachers’ average satisfaction rating for “relevance of the program to your students” was 6.4, “students benefited from BUILD Strategy instruction” was 6.0, “instruction was easy to use and incorporate” was 6.2, and “students can make decisions in groups more effectively than without using the strategy” was 6.4. Satisfaction with “student materials” was rated 6.3, and overall satisfaction with the program was 6.4. Students also indicated that they were satisfied with the program, with mean scores on items ranging from 5.5 to 5.7. Eighty-six percent of the students recommended that all fourth- or fifth-grade students receive this instruction.
Conclusions
The BUILD Strategy instructional program can be successfully used to increase student knowledge about resolving issues and to teach students to resolve two-sided issues in small cooperative groups. Both teachers and students were satisfied with various aspects of the program.
Reference
Vernon, D. S. (1998). Effects of instruction in The BUILD Strategy: Progress report. Washington, D.C.: National Institute of Mental Health, SBIR Phase II #R44 MH47211.
Overview
The BUILD Strategy is used by cooperative groups to resolve a two-sided issue. The research was conducted in 18 fifth-grade general education classes. Six teachers participated in this CD program to learn how to provide instruction in the strategy. They worked through the CD program individually. They also read the BUILD Strategy instructor’s manual. They taught the strategy to a total of 125 students. They will be referred to as the “multimedia-workshop group.” Six additional teachers simply read the instructor’s manual for the BUILD Strategy and taught the strategy to their 113 students. They will be referred to as the “manual-only group.” Six more teachers and their 109 students served as the comparison group. The comparison teachers did not teach the BUILD Strategy to their students. The teachers were randomly assigned to the groups.
Results
Measures were gathered on the fidelity of the multimedia-workshop teachers’ and manual-only teachers’ implementation of the instruction, their quality of instruction, and the quality of the instructional environment. The General Linear Mixed Model (GLMM) analysis for the Quality of Instruction measure revealed a significant difference between the two groups [F(1,10) = 5.59, p = .04] with higher scores for the CD group. A t-test for the Environment measure revealed a significant difference between the groups as well (t(4) = 3.904, p = .011). No difference was found between the implementation results for the two groups of experimental teachers. Both groups implemented the program.
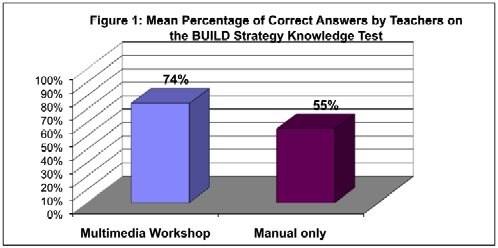
Figure 1 displays the mean percentage scores that the multimedia workshop and manual-only teachers earned on a test of their knowledge of the instructional methods and the strategy. A t-test for independent groups revealed a significant difference in favor of the multimedia workshop group, t(10) = 2.895, p = .016.
Figure 2 displays the mean percentage scores earned by students of the three groups of teachers on a written test of their knowledge of the BUILD Strategy. The data were analyzed comparing the three groups of students’ raw posttest scores while controlling for the pretest scores. The results showed that the adjusted mean scores on the posttests were significantly different, F(2,14) = 1267.331, p < .001, η2 = .995. Follow-up comparison tests revealed significant differences between the posttest scores of the comparison and the multimedia workshop groups, p = .000, and between the comparison and the manual only groups, p = .000. The posttest scores of the multimedia workshop group and the manual only group were not statistically different from each other.
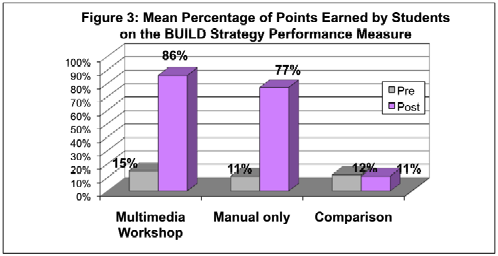
Figure 3 displays the mean percentage of points earned by the students as they used the BUILD Strategy in cooperative groups in their classrooms to resolve issues. GLMM results indicated that the multimedia workshop and manual only groups earned significantly higher scores than the comparison group, F (2, 15.1) = 32.88, p < .0001. Significant differences were found between the posttest scores of the comparison and the multimedia workshop groups, p = .000, and between the comparison and the manual only groups, p = .000. The posttest scores of the multimedia workshop group and the manual only group were not statistically different from each other.
Conclusions
These results show that the Professional Development CD Program is effective in instructing teachers in how to teach the BUILD Strategy to students. The quality of instruction and the instructional environments created by teachers who used the program received significantly higher scores than those created by teachers who only read the instructor’s manual. In addition, the teachers who used the CD program demonstrated significantly more knowledge about the program than the manual-only teachers. Although there were no significant differences between the two groups of experimental students, the students of the teachers who used the CD program performed better than the students of the manual-only students on both measures. Both groups of experimental students performed significantly and substantially better than the comparison students on both measures. Thus, not only is the CD program effective with teachers, the instructional program associated with the BUILD Strategy is effective in producing student change.
Reference
Vernon, D. S. (2004). Effects of a professional development software program for the BUILD Strategy Program: Progress Report for SBIR Phase II Grant #R44HD36139. Washington D.C.: National Institute of Child Health and Human Development.
Overview
The LEARN Strategy is used by cooperative groups to study and learn subject-area information. The research was conducted in 25 fourth- and fifth-grade general education classes. These intact classes were randomly assigned to the experimental or control condition. A total of 519 students participated. The 13 teachers of the experimental classes taught their students the SCORE Skills and the LEARN Strategy. The twelve control teachers did not teach the SCORE Skills or the LEARN Strategy to their students.
Results
Observational data were gathered on the fidelity of the experimental teachers’ implementation of the instruction. They presented a mean of 82% of the information on the SCORE Skills and a mean of 84% of the information on the LEARN Strategy, according to a checklist based on the two instructor’s manuals.
All students in experimental and control classes completed a written test of their knowledge about social skills and how to study for tests before and after the instruction. The ANCOVAs revealed significant differences between the posttest scores of experimental and control students for students with exceptionalities, F (1, 22) = 73.10, p < .001, η2 = .77, and for students without exceptionalities, F (1, 22) = 400.29, p < .001, η2 = .95. (These are very large effect sizes.) For students with and without exceptionalities, the adjusted mean for the experimental group was significantly larger than the adjusted mean for the control group. (See Figure 1 for mean scores.)
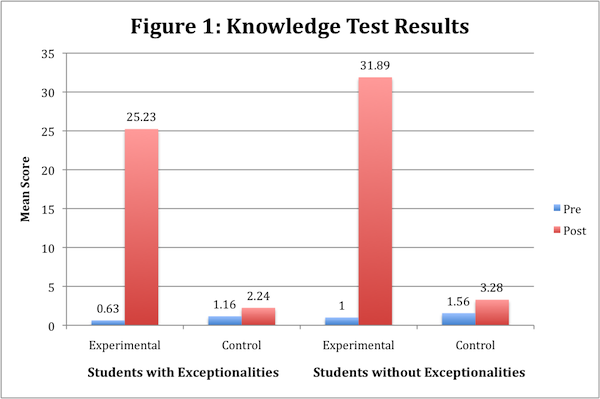
Data were also gathered on the students’ performance as they studied information together in small groups during the pretest and posttest. Since students with and without exceptionalities worked together in these groups, analyses were conducted on the combined group means. Observers determined the percentage of strategy steps the students used. The ANCOVA revealed a significant difference between the experimental and control group posttest scores, F (1, 22) = 21.23, p < .001, η2 = .49, a very large effect size. The adjusted posttest mean for the experimental group was significantly larger than the adjusted posttest mean for the control group. For the experimental group, t-test results indicate that students’ performance increased significantly, t (13) = 8.67, p <.001, from a pretest mean of 6.17 to a posttest mean of 21.63. No significant differences were found for comparison students.
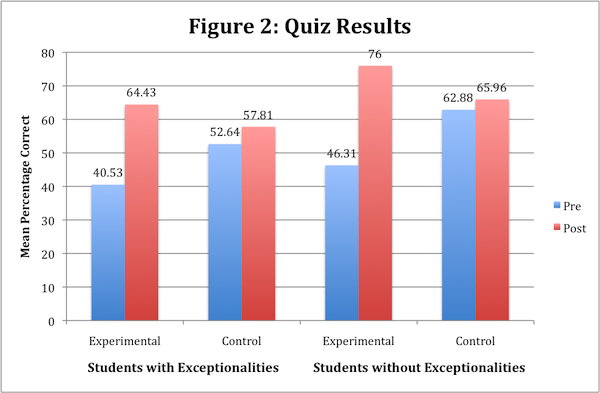
After the students had studied together in their small groups, they took a written quiz independently over the information that they had studied. The ANCOVAs revealed a significant difference between the experimental and control group posttest quiz scores for students with exceptionalities, F (1, 22) = 18.59, p < .001, η2 = .45 (a very large effect size) and for students without exceptionalities, F (1, 22) = 6.22, p = .022, η2 = .22 (a very large effect size). Again, the adjusted posttest mean for the experimental group was significantly larger than the adjusted posttest mean for the control group. (See Figure 2.)
Experimental teachers and students used a 7-point Likert-type scale to rate items regarding their satisfaction with the program (“7” indicating extremely satisfied; “1” indicating extremely dissatisfied) at the end of the year. Teachers endorsed the program, and their ratings indicated satisfaction with each aspect of the program. For example, teachers rated the relevance and benefits of the program in the “very satisfies” range (Mean rating = 6.3). Students also indicated that they were satisfied with the program, with mean scores in the satisfied range.
Conclusions
The LEARN Strategy instructional program can be successfully used to increase student knowledge about social skills and studying with others and to teach students how to study information in small cooperative groups. This is an important skill for students who need the benefits of studying with others. Both teachers and students were satisfied with various aspects of the program.
Reference
Vernon, D. S. (1998). Effects of instruction in The LEARN Strategy: Progress report. Washington, D.C.: National Institute of Mental Health, SBIR Phase II #R44 MH47211.
Overview
The LEARN Strategy is used by cooperative groups to learn information together. This professional development program was designed to provide instruction to teachers so that they can teach the LEARN Strategy to their students. This research study was conducted in 16 fifth-grade general education classes. Five teachers participated in this CD program (hereafter referred to as the “multimedia workshop”) to learn how to provide instruction in the LEARN Strategy. They taught a total of 92 students the strategy. Six additional teachers simply read the instructor’s manual for the LEARN Strategy and taught the strategy to their 120 students. Five additional teachers and their 81 students served as comparison classes. The comparison teachers did not teach the LEARN Strategy to their students and did not receive any instruction related to the LEARN Strategy. The teachers were randomly assigned to the groups.
Results
Measures were gathered on the fidelity of the multimedia workshop teachers’ and manual-only teachers’ implementation of the instruction, their quality of instruction, and the quality of the instructional environment. The results are shown in Figure 1. No differences were found between the results for the two groups of teachers who received instruction.
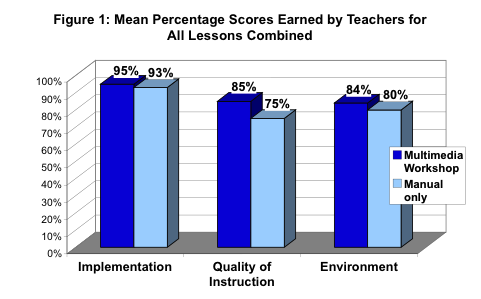
Figure 2 displays the mean percentage scores the two multimedia-workshop and manual-only teachers earned on a test of their knowledge of the instructional methods and the LEARN Strategy. No difference was found between the test scores for the two groups, F(1,9)=1.07, p = .328.
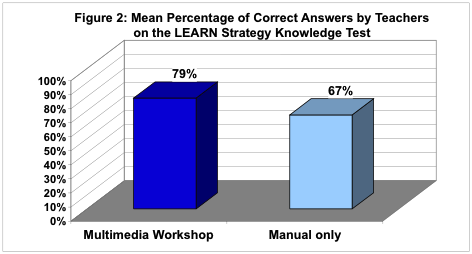
Figure 3 displays the mean percentage scores earned by students of the three groups of teachers on a written test of their knowledge of the strategy. The data were analyzed comparing the three groups of students’ raw posttest scores while controlling for the pretest scores. The results showed that the adjusted mean scores on the posttests were significantly different, F(2,13)=52.7, p = .0001. Follow-up comparison tests revealed significant differences between the posttest scores earned by the comparison and the multimedia-workshop groups, t(1, 13.3)=9.01, p < .0001, and between the comparison and the manual-only groups, t(1, 13)=8.99, p < .0001. The posttest scores of the multimedia- workshop group and the manual-only group were not statistically different from each other.
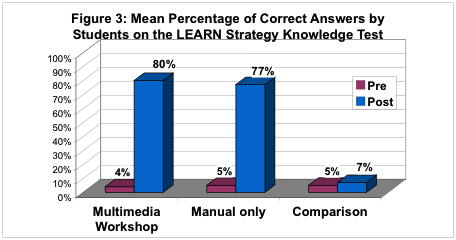
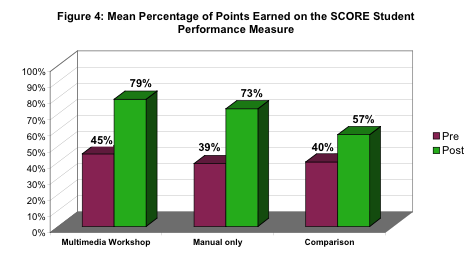
Figure 4 displays the mean percentage of points earned by the students as they used the LEARN Strategy in cooperative groups in their classrooms to study information together. These performance data were analyzed comparing the three groups of students’ posttest raw scores while controlling for the pretest scores. The results showed that the adjusted mean scores on the posttests were significantly different, F(2,12.2)=33.21, p<.0001. Follow-up comparison tests revealed significant differences between the posttest scores of the comparison and the multimedia-workshop groups, t(1,12.2)=6.97, p<.0001, and of the comparison and the manual-only groups, t(1,12.3)=7.26, p<.0001. The posttest scores of the multimedia-workshop group and the manual-only group were not statistically different from each other.
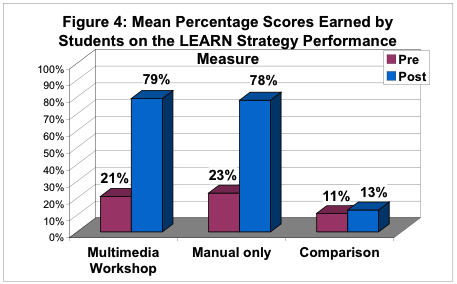
Figure 5 displays the mean percentage of points earned by the students on the study notecards they created in their cooperative groups. The notecard data were analyzed comparing the three groups of students’ posttest raw scores while controlling for the pretest scores. The results showed that the adjusted mean scores on the posttests were significantly different, F(2,13.1) = 37.34, p < .0001. Follow-up comparison tests revealed significant differences between the posttest scores of the comparison and the multimedia- workshop groups, t(1, 13) = 7.71, p < .0001, and between the comparison and the manual-only groups, t(1, 13.3) = 7.37, p < .0001. The posttest scores of the multimedia- workshop group and the manual-only group were not statistically different from each other.
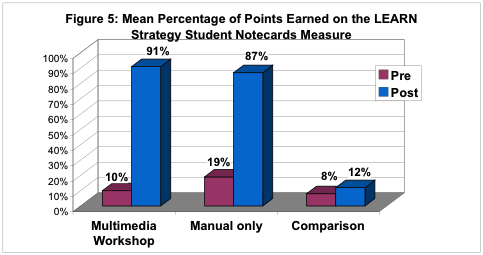
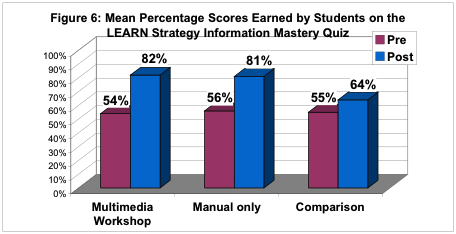
Figure 6 displays the mean percentage scores earned by the students after they were asked to study the information in a short reading passage in their cooperative groups and then take a test over the information independently. The Information Mastery Quiz data were analyzed comparing the three groups of students’ posttest raw scores while controlling for the pretest scores. The results showed that the adjusted mean scores on the posttests were significantly different, F(2,12.2) = 15.34, p = .0005. Follow-up comparison tests revealed significant differences between the posttest scores of the comparison and the multimedia-workshop groups, t(1, 12.6) = 5.03, p = .0003, and of the comparison and the manual-only groups, t(1, 12.2) = 4.69, p = .0005. The posttest scores of the multimedia-workshop group and the manual-only group were not statistically different.
Conclusions
These results show that the Professional Development CD Program is effective in instructing teachers in how to teach the LEARN Strategy to students. There were no significant differences between multimedia-workshop groups and manual-only groups of teachers and students, and both groups of experimental students performed significantly and substantially better than the comparison students on all three student measures. Thus, the professional development CD program for teachers associated with the LEARN Strategy is effective in producing student change.
Reference
Vernon, D.S. (2003). Effects of a professional development software program for the LEARN Strategy Program: Progress Report. SBIR Phase II #R44HD36139. Washington, D.C.: National Institute of Child Health and Human Development.
Overview
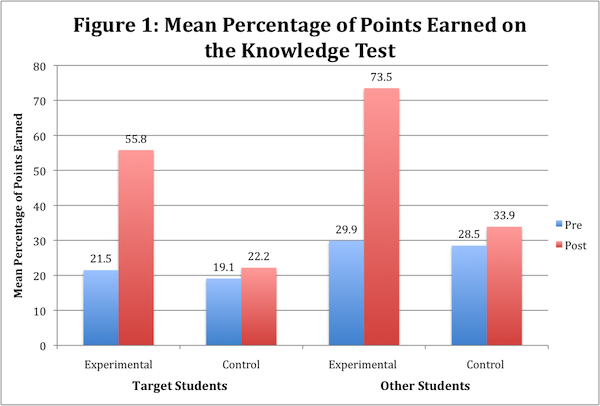
The Teamwork Strategy is used by cooperative groups to complete a group project. The SCORE Skills are basic social skills used during each cooperative-group activity. The research was conducted in a total of six classrooms, two each at the fourth-, fifth-, and sixth-grade levels. Members of these three pairs of intact classes were randomly assigned to the experimental or control condition. A total of 115 students received parental consent to participate, with 57 students enrolled in the experimental classes and 58 students in the control classes. The three teachers of the experimental classes taught their students the SCORE Skills and the Teamwork Strategy. The three control teachers did not teach the SCORE Skills or the THINK Strategy to their students. The performance of two groups of students was monitored: target students and all other students. Target students were students with exceptionalities who were receiving educational services for their disability and/or skill deficits.
Results
Observational data were gathered on the fidelity of the experimental teachers’ implementation of the instruction. They presented a mean of 95% of the information on the SCORE Skills and the Teamwork Strategy, according to a checklist based on the two instructor’s manuals.
All students in experimental and control classes completed a written test of their knowledge about social skills and teamwork skills at pretest and posttest. The ANCOVAs revealed significant differences between the posttest scores of experimental and control students for students with exceptionalities, F (1, 15) = 13.84, p < .002, η2 = .48, and for students without exceptionalities, F (1, 84) = 129.83, p < .001, η2 = .61. (These are very large effect sizes.) For students with and without exceptionalities, the adjusted mean for the experimental group was significantly larger than the adjusted mean for the control group. (See Figure 1 for mean scores.)
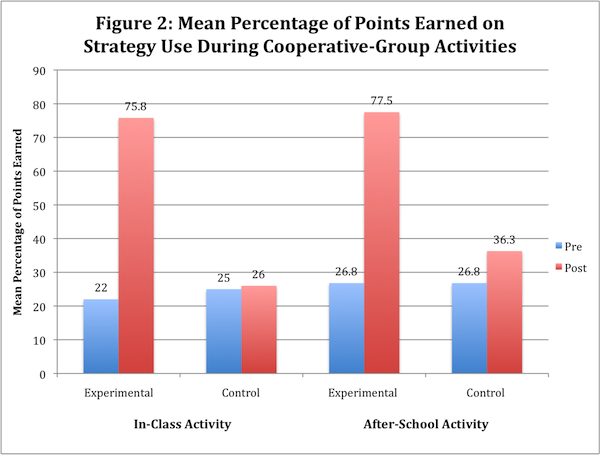
Data were also gathered on the students’ performance as they completed projects together in small groups during the pretest and posttest. Since students with and without exceptionalities worked together in these groups, the analysis was conducted on the combined group means. Observers determined the percentage of social skills and strategy steps the students used. The ANCOVA on the in-class project revealed a significant difference between the experimental and control group posttest scores, F (1, 16) = 53.24, p < .001, η2 = .77, a very large effect size. The ANCOVA on the out-of-class project (a generalization task) also revealed a significant difference between the experimental and control group posttest scores, F (1, 16) = 38.26, p < .001, η2 = .70, also a very large effect size. The adjusted posttest mean for the experimental group was significantly larger than the adjusted posttest mean for the control group in each case. (See Figure 2 for mean scores.)
Experimental teachers and students used a 7-point Likert-type scale to rate items regarding their satisfaction with the program (“7” indicating extremely satisfied; “1” indicating extremely dissatisfied) at the end of the year. Teachers endorsed the program, and their ratings indicated satisfaction with each aspect of the program. For example, teachers’ average satisfaction rating for “relevance of the program to your students” was 6.3, “students benefited from the instruction” was 6.0, “students got along better after the instruction” was 6.3, and “the steps of the Teamwork Strategy were relevant for the students” was 6.0. Students also indicated that they were satisfied with the program, with mean scores on most items ranging from 5.0 to 6.0. One hundred percent of the fourth and fifth graders recommended that all fourth- or fifth-grade students receive this instruction.
Conclusions
The SCORE Skills and Teamwork Strategy instructional programs can be successfully used to increase student knowledge about social skills and completing group tasks and to teach students how to complete group projects successfully in small cooperative groups. This is an important skill for students who will be faced with completing group tasks in work teams the rest of their lives. Both teachers and students were satisfied with various aspects of the program.
Reference
Vernon, D. S. (1998). Effects of instruction in The SCORE Skills and the Teamwork Strategy: Progress report. Washington, D.C.: National Institute of Mental Health, SBIR Phase II #R44 MH47211.
Overview
The SCORE Skills are five basic social skills used by students in cooperative group activities. They include the following skills: Sharing Ideas, Complimenting Others, Offering Help or Encouragement, Recommending Changes Nicely, and Exercising Self Control. The research was conducted in 18 fifth-grade general education classes. The 18 teachers of these classes were randomly assigned to one of three groups. Six teachers used this CD program (hereafter referred to as the “multimedia workshop”) to learn how to provide instruction in the SCORE Skills. They taught a total of 101 students the SCORE Skills. Six other teachers simply read the instructor’s manual for the SCORE Skills program and taught the skills to their 93 students. Six additional teachers and their 114 students served as comparison classes. The comparison teachers did not teach the SCORE Skills to their students.
Results
Measures were gathered on the fidelity of the teachers’ implementation of the instruction and quality of instruction for teachers in the multimedia-workshop group and the manual-only group. The mean percentage scores for the two groups of experimental teachers are shown in Figure 1. T-tests revealed significant differences between the two groups, with higher scores for the multimedia workshop group on the implementation measure, t(5) = 4.227, p = .008, and on the quality of instruction measure, t(5) = 3.576, p = .016.
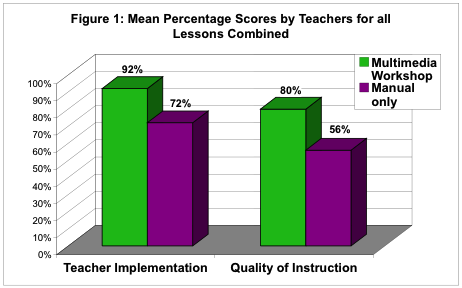
Figure 2 displays the mean percentage scores the multimedia-workshop and manual-only teachers earned on a test of their knowledge of the SCORE Skills and the instructional methods associated with teaching the SCORE Skills . A t-test for independent groups revealed no significant differences, t(5) = 1.908, p = .115, between the groups.
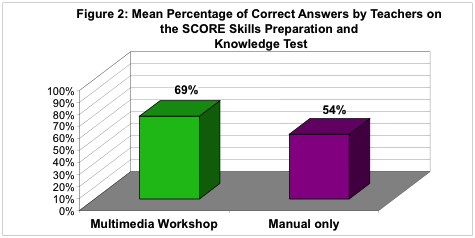
Figure 3 displays the mean percentage scores earned by students of the three groups of teachers on a written test of their knowledge of the SCORE Skills. The data were analyzed comparing the three groups of students’ raw posttest scores while controlling for the pretest scores. The results showed that the adjusted mean scores on the posttests were significantly different, F(2,14) = 82.510, p < .001, η2= .922. Follow-up comparison tests were computed. Significant differences were found between the comparison and the multimedia-workshop groups, p = .001, and between the comparison and the manual-only groups, p = .001. The posttest scores of the multimedia-workshop group and the manual-only group were not statistically different from each other.
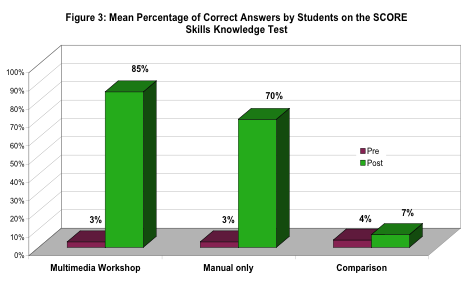
Figure 4 displays the mean percentage of points earned by students as they role-played situations with the researchers. All of the situations required the use of one of the SCORE Skills. GLMM results indicated that the multimedia-workshop and manual-only groups earned significantly higher scores than the comparison group, F(2, 14) = 9.627, p = .002, η2 = .579. Follow-up tests revealed a significant difference between the posttest scores of the comparison and the multimedia-workshop groups, p = .002. No other differences were found.
Conclusions
These results show that the Professional Development CD Program is effective in instructing teachers in how to teach the SCORE Skills to students. The levels of implementation and quality of instruction of teachers who used the CD program were significantly higher than those of teachers who only read the instructor’s manual. Although there were no significant differences between the two groups of experimental students, the students of the teachers who used the CD program performed better than the students of the manual-only students on both student measures. Both groups of experimental students performed significantly and substantially better than the comparison students on both measures. Thus, not only is the CD program effective with teachers, the instructional program associated with the SCORE Skills is effective in producing student change.
Reference
Vernon, D.S. (2001). Effects of a professional development software program for the SCORE Skill: Social Skills for Cooperative Groups Program: Progress Report. SBIR Phase II #R44HD36139. Washington, D.C.: National Institute of Child Health and Human Development.
Overview
The THINK Strategy is used by cooperative groups to solve problems. The research was conducted in 20 fourth- and fifth-grade general education classes. These intact classes were randomly assigned to the experimental or control conditions. A total of 392 students participated. The 10 teachers of the experimental classes taught their students the SCORE Skills and the THINK Strategy. The 10 control teachers did not teach the SCORE Skills or the THINK Strategy to their students.
Results
Observational data were gathered on the fidelity of the experimental teachers’ implementation of the instruction. They presented a mean of 80% of the information on the SCORE Skills and 95% of the information on the THINK Strategy, according to a checklist based on the two instructor’s manuals.
All students in experimental and control classes completed a written test of their knowledge about social skills and problem-solving skills at pretest and posttest. The ANCOVAs revealed significant differences between the posttest scores of experimental and control students for students with exceptionalities, F (1, 19) = 148.03, p < .001, η2 = .90, and for students without exceptionalities, F (1, 19) = 53.36, p < .001, η2 = .76. (These are very large effect sizes.) For students with and without exceptionalities, the adjusted mean for the experimental group was significantly larger than the adjusted mean for the control group. (See Figure 1 for the mean scores.)
Data were also gathered on the students’ performance as they solved problems together in small groups during the pretest and posttest. Since students with and without exceptionalities worked together in these groups, the analysis was conducted on the combined group means. Observers determined the percentage of strategy steps the students used. The ANCOVA revealed a significant difference between the experimental and control group posttest scores, F (1, 19) = 92.03, p < .001, η2 = .84, a very large effect size. The adjusted posttest mean for the experimental group was significantly larger than the adjusted posttest mean for the control group. (See Figure 2 for the mean scores.)
As the students solved problems in their groups, they were to write, on a blank sheet of paper, what was discussed. They earned points according to what they wrote. For example, they earned points for designating a name for the problem, listing background information for the problem, and identifying potential solutions. Again, the ANCOVA was conducted on the combined group means. The ANCOVA revealed a significant difference between the experimental and control group posttest scores, F (1, 18) = 68.25, p < .001, η2 = .81, a very large effect size. The adjusted posttest mean for the experimental group was significantly larger than the adjusted posttest mean for the control group. (See Figure 3.)
Experimental teachers and students used a 7-point Likert-type scale to rate items regarding their satisfaction with the program (“7” indicating extremely satisfied; “1” indicating extremely dissatisfied) at the end of the year. Teachers endorsed the program, and their ratings indicated satisfaction with each aspect of the program. Students also indicated that they were satisfied with the program, with mean scores on items ranging from 5.4 to 5.6. Eighty-six percent of the students recommended that all fourth- and fifth-grade students receive this instruction.
Conclusions
The THINK Strategy instructional program can be successfully used to increase student knowledge about social skills and solving problems with others and to teach students how to solve problems in small cooperative groups. This is an important skill for students who will be faced with solving problems on committees and in meetings and work groups the rest of their lives. Both teachers and students were satisfied with various aspects of the program.
Reference
Vernon, D. S. (1998). Effects of instruction in The THINK Strategy: Progress report. Washington, D.C.: National Institute of Mental Health, SBIR Phase II #R44 MH47211.
Overview
The THINK Strategy is used by cooperative groups to solve complex problems. The research was conducted in 16 fifth-grade general education classes. The sixteen teachers of these classes were randomly assigned to one of three groups. Five teachers independently worked through this CD program (hereafter referred to as the “multimedia workshop” group) to learn how to provide instruction in the THINK Strategy. They taught a total of 139 students the strategy. Six teachers simply read the instructor’s manual for the THINK Strategy and taught the strategy to their 123 students. They will hereafter be referred to as the “manual-only” group. Five additional teachers and their 92 students served as comparison classes. The comparison teachers did not teach the THINK Strategy to their students.
Results
Measures were gathered on the fidelity of the multimedia-workshop teachers’ and manual-only teachers’ implementation of the instruction, their quality of instruction, and the quality of the instructional environment they created. The results are shown in Figure 1. Statistical analyses revealed a significant difference between the two groups on the implementation measure, t(5) = 2.648 p = .046, and on the quality of instruction measure, t(10) = -2.565 p < .0286, in favor of the multimedia group in both cases. There was no difference between the environments created by the teachers.
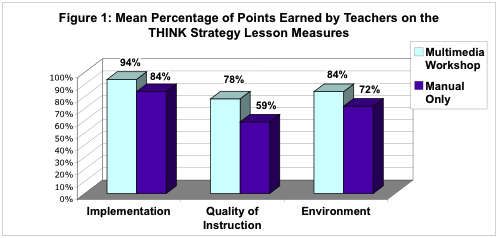
Figure 2 displays the mean percentage scores that the two groups of experimental teachers earned on a test of their knowledge of the instructional methods and the strategy. This test contained open-ended questions requiring written answers. A t-test for independent groups revealed a significant difference in favor of the multimedia workshop group, t(10) = -3.899, p <.003.
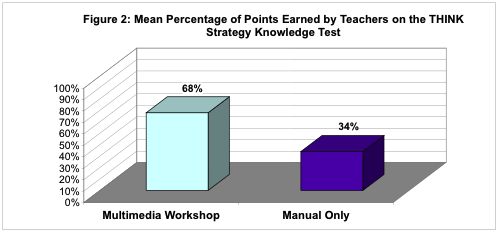
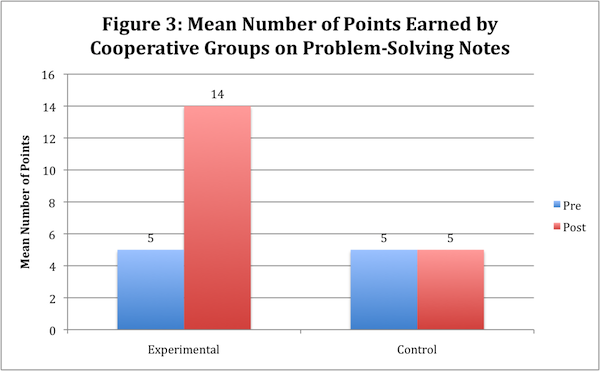
Figure 3 displays the mean percentage scores earned by students of the three groups of teachers on a written test of the students’ knowledge of the THINK Strategy. The data were analyzed comparing the three groups of students’ raw posttest scores while controlling for the pretest scores. The results showed that the adjusted mean scores on the posttests were significantly different, F(2,14), = 44.150, p < .000, η2 = .863. Follow-up comparison tests revealed significant differences between the posttest scores of the comparison and the multimedia-workshop groups, p = .000, and of the comparison and the manual-only groups, p = .000. The posttest scores of the multimedia-workshop group and the manual-only group were not statistically different from each other.
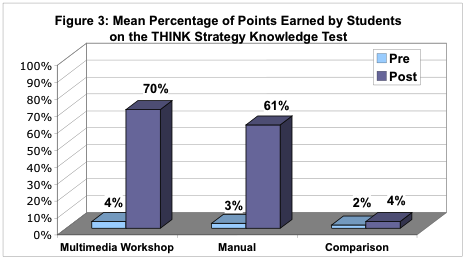
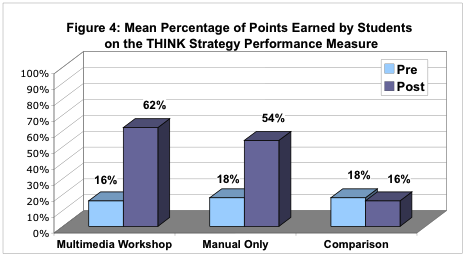
Figure 4 displays the mean percentage of points earned by the students as they used the THINK Strategy in cooperative groups in their classrooms to complete assignments related to solving problems. The performance data were analyzed comparing the three groups of students’ raw posttest scores while controlling for the pretest scores. The results showed that the adjusted mean scores on the posttests were significantly different, F(2, 14), = 16.200, p = .000, η2 = .5698. Follow-up comparison tests revealed significant differences between the posttest scores of the students in the comparison and the multimedia-workshop groups, p = .003, and between students in the comparison and the manual-only groups, p = .012. The posttest scores of students in the multimedia-workshop group and the manual-only group were not statistically different from each other.
Conclusions
These results show that the Professional Development CD Program is effective in instructing teachers in how to teach the THINK Strategy to students. The levels of implementation and quality of instruction of the teachers who used the CD program were significantly higher than those created by teachers who only read the instructor’s manual. In addition, the teachers who used the CD program demonstrated significantly more knowledge about the program than the manual-only teachers. Although there were no significant differences between the two groups of experimental students, the students of the teachers who used the CD program performed better than the students of the manual-only students on both measures. Both groups of experimental students performed significantly and substantially better than the comparison students on both measures. Thus, not only is the CD program effective with teachers, the instructional program associated with the THINK Strategy is effective in producing student change.
Reference
Vernon, D.S. (2001). Effects of a professional development software program for the THINK Strategy: Progress Report. SBIR Phase II #R44HD36139. Washington, D.C.: National Institute of Child Health and Human Development.