Research: The Community Building Series
The Community Building Series Research Resources
Overview
The Focusing Together Program is used to teach students how to stay on task and be productive in their classrooms while following basic classroom rules. To test the effects of the instructional program, a study was conducted in eight classrooms with a total of 225 students in grades four and five. The classrooms were randomly selected into an experimental and a control group. The four teachers of the experimental classes taught their students the strategies associated with the Focusing Together Program and continued using the program with the students. The four teachers in the control classes did not use the Focusing Together Program.
Observers visited the eight classrooms regularly. They observed the off-task behaviors of five students in each classroom using an interval recording system, with intervals lasting 60 seconds long. Each group of five students included one high achiever, one average achiever, one low achiever, and two students with disabilities. The observations lasted 15 minutes each during a time when students were completing independent work. Six observations were completed in each classroom, with three observations occurring at the beginning and three at the end of the study. Example off-task behaviors included being out of one’s seat, looking around the room, talking, playing with objects, and not following the teacher’s directions.
Results
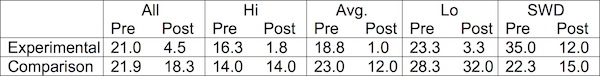
At the beginning of the study, the observers recorded a mean of 21 off-task intervals in the experimental classrooms and a mean of 22 off-task intervals in the control classrooms (within the total of 45 intervals). At the end of the study (after the experimental classes had Focusing Together instruction), the observers recorded a mean of 5 off-task intervals for the experimental students and 18 off-task intervals for the control students. All types of students in the experimental classrooms exhibited a decrease in the number of off-task intervals. See Table 1 for results for the subgroups of students.
When the teachers were asked to rate their satisfaction with their own class management skills and how well their students followed the rules and worked independently, the experimental teachers had a mean rating of 6.06, and the control teachers had a mean rating of 3.56 on a 7-point scale (with “7” equal to “completely satisfied”).
Moreover, when asked to report rule infractions for a two-week period at the beginning and end of the study, the experimental teachers reported a 72% reduction, while the control teachers’ report remained the same across the study period.
Conclusions
This study showed that students with reading and writing disabilities could learn to write essay answers in response to essay questions such that their content and organization improved. In addition their essay answers were comparable to the answers of students without disabilities.
Reference
Rademacher, J. A., Pemberton, J. B., & Cheever, G. L. (2006). Focusing together: Promoting self-management skills in the classroom. Lawrence: Edge Enterprises, Inc.
Overview
The Following Instructions Together Program is used to teach students how to follow simple and complex instructions and to teach them how to help partners follow instructions. The research was conducted in 17 third- and fourth-grade general education classes. These intact classes were randomly assigned to the experimental or comparison condition. A total of 350 students participated in the pretest-posttest comparison-group design. The nine teachers of the experimental classes taught their students using the Following Instructions Together Program. The eight comparison teachers did not use this program.
Results
Observational data were gathered on the fidelity of the experimental teachers’ implementation of the instruction. They presented a mean of 89% of the information in the Following Instructions Together instructor’s manual.
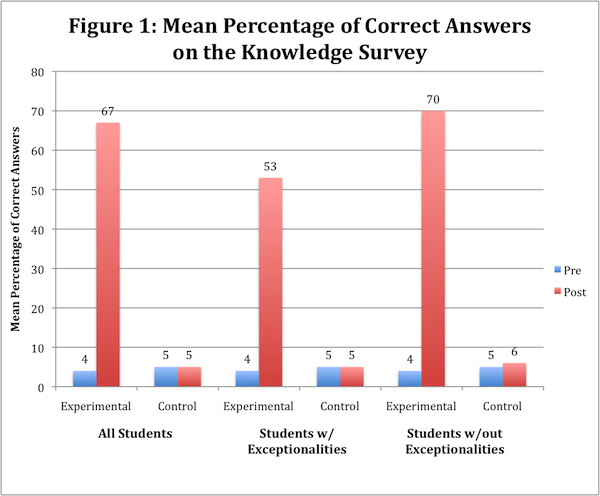
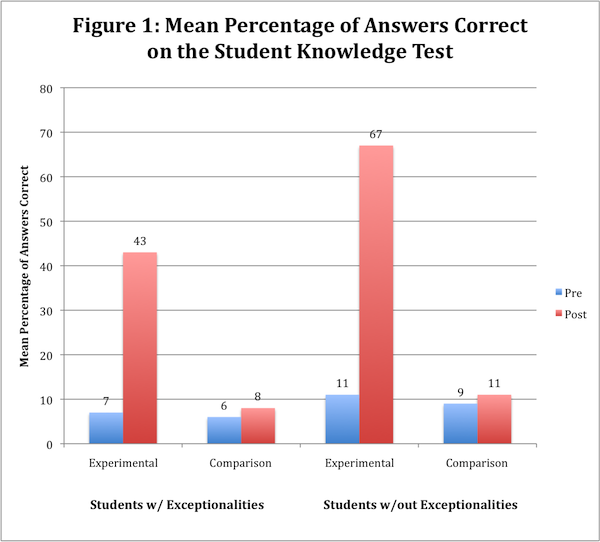
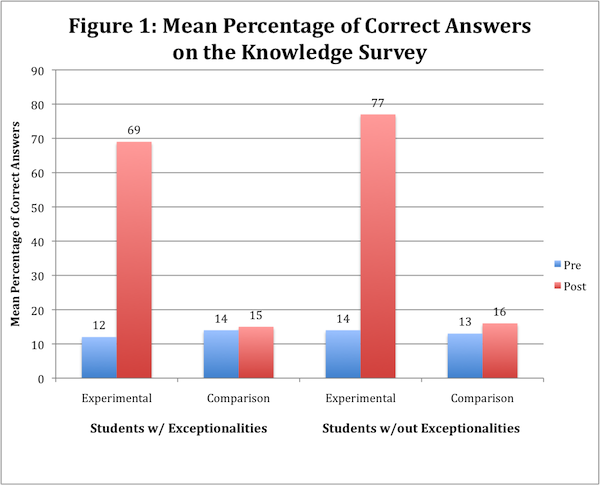
All students in experimental and comparison classes completed a written test of their knowledge about following instructions and community-building skills at pretest and posttest. The ANCOVAs revealed significant differences between the posttest scores of experimental and comparison students with exceptionalities, F (1, 49) = 94.732, p < .001, η2 = .659, and students without exceptionalities, F (1, 12) = 663.131, p < .001, η2 = .978. (These are very large effect sizes.) For students with and without exceptionalities, the adjusted means for the experimental group were significantly larger than the adjusted means for the comparison group. (See Figure 1 for the mean scores.)
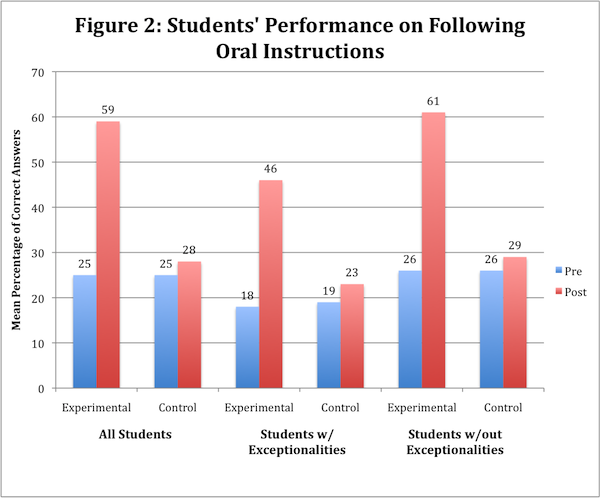
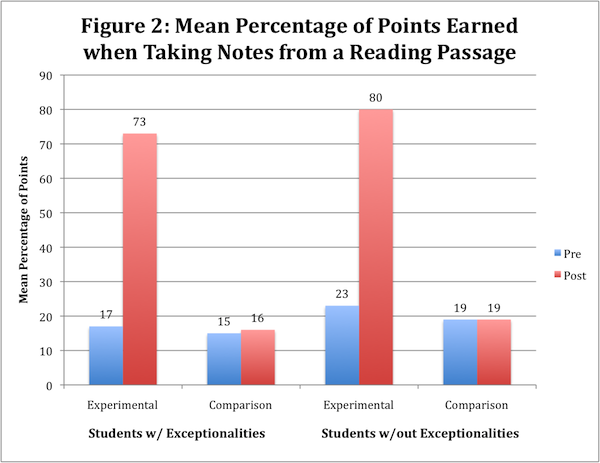
Data were also gathered on the students’ performance as they completed a worksheet that involved following instructions. The ANCOVAs revealed significant differences between the posttest worksheet scores of experimental and comparison students with exceptionalities, F (1, 49) = 13.629, p < .001, η2 = .218, and students without exceptionalities, F (1, 15) = 41.841, p < .001, η2 = .736. (These are very large effect sizes.) For students with and without exceptionalities, the adjusted means for the experimental group were significantly larger than the adjusted means for the comparison group. (See Figure 2 for the mean scores.)
Experimental teachers and students used a 7-point Likert-type scale to rate items regarding their satisfaction with the program (“7” indicating “extremely satisfied”; “1” indicating “extremely dissatisfied”) at the end of the year. Teachers endorsed the program, and their ratings indicated satisfaction with each aspect of the program. For example, teachers’ average satisfaction rating for “relevance of the program to your students” was 6.9, “students benefited from the instruction” was 6.7, “instruction was easy to use and incorporate” was 6.9, and overall satisfaction with the program was 6.9. Students also indicated that they were satisfied with the program, with mean scores on items ranging from 5.6 to 6.3. Ninety percent of the students recommended that all third-, fourth-, or fifth-grade students receive this instruction.
Reference
Vernon, D.S. (2000). Effects of the Following Instructions Together program: Progress summary for SBIR Phase II Grant #1R44HD34306. Washington, D.C.: National Institute of Child Health and Human Development.
Overview
The Following Instructions Together program is used to teach students how to follow simple and complex instructions. To test the effects of a CD program for instructing teachers in how to teach the Following Instructions Together Program, a study was conducted with 18 general education teachers who taught 330 students in grades 4 and 5, 40% of whom represented minority populations and 33% of whom were students with exceptionalities. The teachers and their students were randomly selected into one of two groups. Nine teachers worked through this CD program and the instructor’s manual (hereafter referred to as the “CD group”) to learn how to use the Following Instructions Together Program. Nine teachers (hereafter referred to as the “manual group”) read the instructor’s manual. The purpose of the study was to determine the comparative effects of the CD/manual combination and the manual alone in terms of teacher and student outcomes.
A multiple-baseline across-teachers design was used to determine the effects of instructing the teachers on the teachers’ implementation of the program. A posttest-only control-group design was used to determine the effects of the two methods of teacher instruction on teacher knowledge. A pretest-posttest control- group design was used to determine the effects of the teacher instruction on student knowledge of instruction following and student response to instructions. Three types of analysis were used: analysis of variance (ANOVA), analysis of covariance (ANCOVA), and the general linear mixed model (GLMM). All outcome (dependent) variables used in these analyses were treated as continuous variables. All analyses were conducted using a level of significance (alpha) of .05.
Results
The teachers’The teachers’ implementation of the Following Instructions Together Program was measured in the classroom after they had read the manual or worked through the CD and the manual. The mean percentage of instructional steps implemented by the CD group was 94%; the mean percentage of steps implemented by the manual group was 85%. The after-training implementation scores of the two groups were compared using the general linear mixed model. A significant difference was revealed, F(1, 16.1) = 3.23, p = .005, indicating that the CD/manual combination was more effective than the manual alone.
The two groups of teachers also took a written test of their knowledge of the Following Instructions Together Program. An Analysis of Variance (ANOVA) revealed no significant difference between the posttest scores of the groups, F (1, 16) = 3.14, p = 0.095, probably because of the relatively small number of teachers. However, the effect size was large (.64). The CD group earned a mean score of 75% on the posttest, and the manual group earned a mean score of 54% on the posttest.
The CD group teachers completed a satisfaction questionnaire about the CD program. Their mean ratings on items on a 7-point Likert-type scale (with “7” indicating “completely satisfied” to “1” indicating “completely dissatisfied”) ranged from 6.1 to 6.8, with an overall mean rating of 6.3. Teachers in both groups completed a satisfaction questionnaire about the Following Instructions Together Program. The manual group had an overall mean rating of 6.1, and the CD group had an overall mean rating of 6.4.
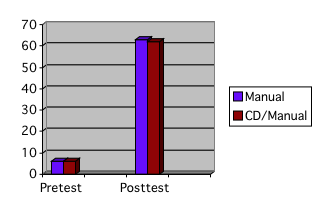
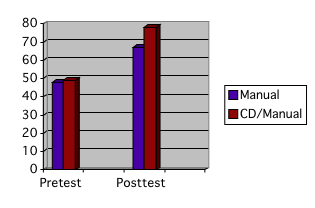
The students in the two groups of classes took a written test of their knowledge of following instructions. No differences were found between the groups at posttest. Both groups’ scores significantly improved from pretest to posttest. (See Figure 1 for mean scores.)
Figure 1. Mean pretest and posttest scores for the Student Knowledge Test
The classes were given a standard set of oral instructions by their teacher before and after instruction in the Following Instructions Together program. The general linear mixed model approach revealed a significant difference between the two groups of students’ posttest scores (after controlling for the pretest scores), F(1, 16) = 4.6, p = .048, with the CD group students earning higher scores than the manual group students on the series of following instructions tasks. See Figure 2 for mean scores.)
Figure 2. Mean pretest and posttest scores for students during the Teacher-led Oral Instruction Activity
The students also completed a satisfaction questionnaire. The mean rating for manual group students was 5.6 and for the CD group students was 5.8.
Conclusions
Working through the CD professional development program combined with reading the manual produces better results in terms of teacher implementation of the program than does reading the manual alone. The combination training also produces better results with regard to student performance on a series of instruction-following tasks. Teachers in the CD group were satisfied with the CD program, and teachers in both groups were satisfied with the Following Instructions Together Program. Students in both groups were satisfied with the Following Instructions Together Program.
Reference
Vernon, D.S. (2005). Effects of a professional development software program for the Following Instructions Together program: Progress Report for SBIR Phase II Grant
#R44HD41819. Washington, D.C.: National Institute of Child Health and Human Development.
Overview
The Organizing Together Program is used to teach students how to organize their notebooks, desks, and lockers. The research was conducted in four, fourth-grade general education classes. Two classes were randomly selected for the experimental condition; the other two were selected for the comparison condition. A total of 124 students participated, with 64 in the experimental classes and 60 in the comparison classes. Students ranged in age from 7 to 10 years. Twenty-seven percent were students with exceptionalities; 32% were representatives of minority populations. The teachers of the experimental classes taught their students the Organizing Together Program. The teachers of the comparison classes did not use this program.
Results
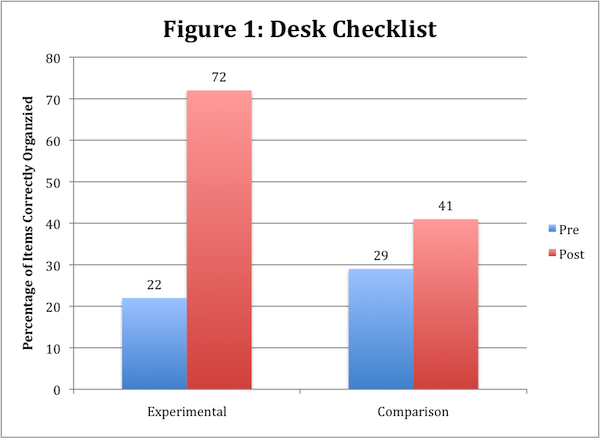
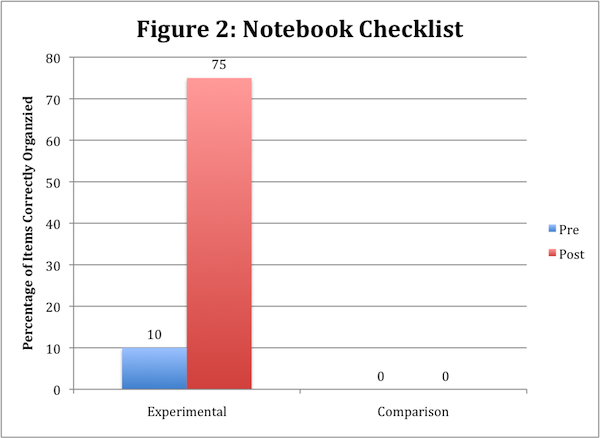
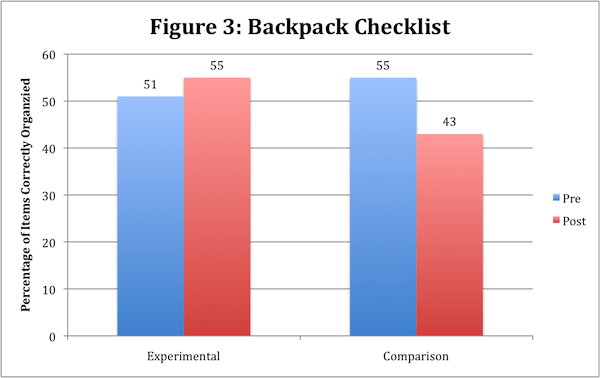
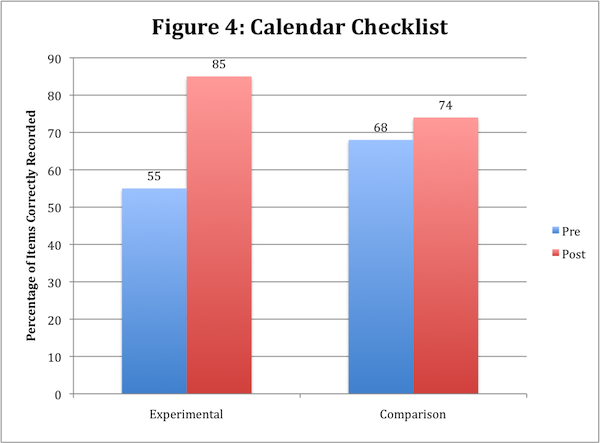
Data were also gathered on organization of the students’ desks, notebooks, and backpacks. Observers determined the percentage of items completed correctly on a checklist related to each item inspected. Figures 1, 2, 3, and 4 show the mean percentage of items correctly organized in the students’ desks, notebooks, backpacks, and calendars, respectively. Experimental students organized more items in their desks, notebooks, backpacks, and calendars than the comparison students. The ANCOVAs (using the pretest scores as the covariate) showed that the adjusted mean scores gathered during observations after the experimental classes participated in Organizing Together instruction were significantly different between the experimental and comparison students for desk organization [F (1, 123) = 49.286, p < .000, η2 = .280], notebook organization [F (1, 112) = 833.300, p < .000, η2 = .887], backpack organization [ F (1, 117) = 12.814, p < .001, η2 = .109], and calendar recordings [F (1, 108) = 22.173, p < .0001, η2 = .389]. (These η2s represent large and medium effect sizes.) The adjusted mean scores for the experimental group were significantly larger than the adjusted mean scores for the comparison group in all cases.
Experimental teachers and students used a 7-point Likert-type scale to rate items regarding their satisfaction with the program (“7” indicating extremely satisfied; “1” indicating extremely dissatisfied) at the end of the year. Teachers endorsed the program, and their ratings indicated satisfaction with each aspect of the program, with mean ratings on individual items ranging from 6.3 to 7.0. Their mean overall rating for the program was 6.7. Students also indicated that they were satisfied with the program, with mean scores on items ranging from 5.2 to 5.8. The students’ mean rating for the program overall was 5.5. Ninety percent of the students recommended that all third-, fourth-, and fifth-grade students receive this instruction.
Reference
Vernon, D.S. (2000). Effects of the Organizing Together program: Progress summary. Washington, D.C.: National Institute of Child Health and Human Development, SBIR Phase II #1R44HD34306.
Overview
The Organizing Together Program is used to teach students how to organize their materials and calendars. To test the effects of a CD program for instructing teachers in how to teach the Organizing Together Program, a study was conducted with 17 general education teachers who taught a total of 293 students in grades 4 and 5. The teachers were randomly selected into three groups. Six teachers worked through this CD program and the instructor’s manual (hereafter referred to as the “CD group”) to learn how to use the Organizing Together Program. They used the program in their general education classes with a total of 121 students. Five teachers (hereafter referred to as the “manual-only group”) read the instructor’s manual. These teachers used the program with a total of 91 students. Six additional teachers received no instruction; they and their 81 students served as the “comparison group.”
The purpose of the study was to determine the comparative effects of CD/manual combination, the manual alone, and no instruction in terms of teacher and student outcomes. A posttest-only control-group design was used to determine the effects of the two methods of teacher instruction (CD + manual vs. manual only) on teacher knowledge, implementation of the program, and quality of instruction. A pretest-posttest control-group design was used to compare teacher scores on a class organization measure. A pretest-posttest control-group design was also used to determine the effects of the teachers’ instruction on student organization. Four types of analyses were used: analysis of covariance (ANCOVA), a repeated-measures factorial design, an Omnibus F test, and the general linear mixed model (GLMM) approach. All outcome (dependent) variables used in these analyses were treated as continuous variables. All analyses were conducted using a level of significance (alpha) of .05.
Results
The teachers’ implementation of the Organizing Together Program was measured in the classroom after they had read the manual or worked through the CD and the manual. The mean percentage of instructional steps implemented by the CD group was 96%; the mean percentage of steps implemented by the manual-only group was 88%. The posttest (after-training) scores of the two groups were compared using the hierarchical linear model. A significant difference was revealed, F(1, 19) = 6.87, p = .028, indicating that the CD/manual combination was more effective in producing implementation than the manual alone.
The quality of the teachers’ instruction was measured by observers using a checklist that listed the components/of quality instruction. Although the mean percentage of quality components was higher for the CD group (M = 90%) than for the manual group (M = 84%), no statistical difference was found between the groups on this measure.
The two groups of instructed teachers also took a written test of their knowledge of the Organizing Together Program. An ANOVA revealed a marginally significant difference between the posttest scores of the CD and manual-only groups, F (1,9) = 4.81, p = .056; however, the effect size, measured by partial eta-squared, was .348, a large effect according to the guidelines provided by Cohen (1988), with the CD group earning a higher mean score (M = 88%) than the manual group (M = 72%).
Observers measured the general level of organization in the classrooms using a checklist. The Omnibus test for the equality of the three means indicated a statistically significant difference, F (2,13) = 13.58, p = .001. The partial eta-squared statistic was .68, representing a very large effect (Cohen, 1988). Follow-up tests revealed significant differences between the comparison group and the CD group and between the CD group and the manual-only group, both in favor of the CD group. There was no significant difference found between the manual-only group and the comparison group.
The students in the three groups of classes took a written test of their knowledge about organizing skills. The Omnibus F-test revealed significant differences between the means of the student groups, F (2, 14.4) = 80.84, p < .0001. Follow-up tests revealed significant differences between the comparison group and each of the treatment groups, in favor of the treatment groups. No significant difference was found between the two treatment groups. (See Figure 1 for mean scores.)
Figure 1. Mean pretest and posttest percentage scores for the Student Knowledge Test
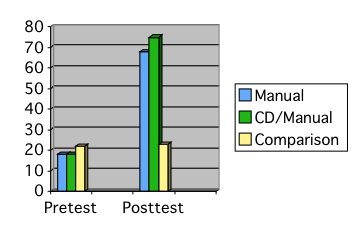
Observers used a checklist to measure student performance in organizing their desks, backpacks, calendars, and notebooks in each classroom. The results of the Omnibus F-test indicated a significant difference in the mean posttest scores of the groups, F (2,12.5) = 297.34, p < .0001. Results of follow-up tests indicated significant differences between the comparison group and each of the treatment groups, but no significant difference was found between the two treatment groups. (See Figure 2 for mean scores.)
Figure 2. Mean pretest and posttest percentage scores for the Student Organization Checklist
The CD group teachers completed a satisfaction questionnaire about the CD program. Their mean ratings on items on a 7-point Likert-type scale (with “7” indicating “completely satisfied” to “1” indicating “completely dissatisfied”) ranged from 6.3 to 6.8, with an overall mean rating of 6.8. Teachers in both instructed groups completed a satisfaction questionnaire about the Organizing Together Program. The manual-only group had an overall mean rating of 6.35, and the CD group had an overall mean rating of 6.49.
The students also completed a satisfaction questionnaire. The mean rating for manual group students was 5.84 and for CD group students was 5.91 on a 7-point scale.
Conclusions
Working through the CD professional development program combined with reading the manual produces better results in terms of teacher implementation of the program and teacher knowledge than does reading the manual alone. Additionally, the CD program produced more highly organized classrooms in terms of teacher organization. Both reading the manual alone and the combined professional development approach yielded large gains in student organization. It also produced greater student knowledge of organizational skills. Teachers in the CD group were satisfied with the CD software program, and teachers in both groups were satisfied with the Organizing Together Program. Likewise, students in both groups were satisfied with the Organizing Together Program.
References
Vernon, D.S. (2005). Effects of a professional development software program for the Organizing Together program: Progress Report. SBIR Phase II # R44HD41819. Washington, D.C.: National Institute of Child Health and Human Development.
Overview
The Taking Notes Together Program is used to teach students how to take notes as well as help their partners take notes. The research was conducted in 20 fourth- and fifth-grade general education classes. These intact classes were randomly assigned to the experimental or comparison condition. A total of 379 students participated, with 190 in the experimental classes and 189 in the comparison classes. The 10 teachers of the experimental classes taught their students using the Taking Notes Together Program. The 10 comparison teachers did not use this program; they provided regularly scheduled instruction.
Results
Observational data were gathered on the fidelity of the experimental teachers’ implementation of the instruction. They presented a mean of 88% of the information in the Note Taking Together instructor’s manual.
All students in experimental and comparison classes completed a written test of their knowledge about taking notes at pretest and posttest. The ANCOVAs revealed significant differences between the posttest scores of experimental and comparison students with exceptionalities, F (1, 17) = 68.32, p < .001, η2 = .80, and students without exceptionalities, F (1, 17) = 86.91, p < .000, η2 = .84. (These are very large effect sizes.) For students with and without exceptionalities, the mean scores for the experimental group were significantly larger than the mean scores for the comparison group. (See Figure 1 for mean scores.)
Data were also gathered on the students’ performance as they took notes independently from a reading passage. The ANCOVAs revealed significant differences between the posttest scores of experimental and comparison students with exceptionalities, F (1, 17) = 74.21, p < 0.00, η2 = .81, and students without exceptionalities, F (1, 17) = 109.62, p < .001, η2 = .87. (These are very large effect sizes.) For students with and without exceptionalities, the mean scores for the experimental group were significantly larger than the mean scores for the comparison group. (See Figure 2 for mean scores.)
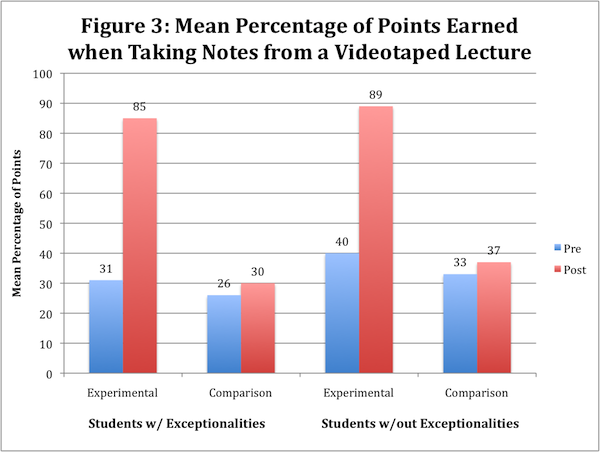
Additionally, data were gathered on the students’ performance as they took notes independently while watching a videotaped lecture. The ANCOVAs revealed significant differences between the posttest scores of experimental and comparison students with exceptionalities, F (1, 17) = 62.04, p < 0.00, η2 = .79, and students without exceptionalities, F (1, 17) = 124.33, p < .001, η2 = .88. (These are very large effect sizes.) For students with and without exceptionalities, the mean scores for the experimental group were significantly larger than the mean scores for the comparison group. (See Figure 3 for mean scores.)
Experimental teachers and students used a 7-point Likert-type scale to rate items regarding their satisfaction with the program (“7” indicating extremely satisfied; “1” indicating extremely dissatisfied) at the end of the year. Teachers endorsed the program, and their ratings indicated satisfaction with each aspect of the program. For example, teachers’ average satisfaction rating for the instructor’s manual was 6.8, for the student materials was 6.9, the ease of use of the program was 6.7, and their overall satisfaction with the program was 6.9. Students also indicated that they were satisfied with the program. Ninety percent of the students recommended that all third-, fourth-, and fifth-grade students receive this instruction.
Reference
Vernon, D.S. (2000). Effects of the Taking Notes Together program: Progress summary. Washington, D.C.: National Institute of Child Health and Human Development, SBIR Phase II #1R44HD34306.
Overview
The Taking Notes Together Program is used to teach students how to take notes from written products and lectures. To test the effects of a software program for instructing teachers in how to teach the Taking Notes Together Program, a study was conducted with 20 general education teachers who taught a total of 338 students in grades 4 and 5. The teachers were randomly selected into an experimental or a control group. Nine teachers worked through the CD program and the instructor’s manual (hereafter referred to as the “CD group”) to learn how to use the Taking Notes Together Program. They taught the Taking Notes Together program in their general education classes with a total of 167 students. Ten teachers (hereafter referred to as the “manual-only group”) read the instructor’s manual. These teachers taught the Taking Notes Together program with a total of 171 students.
The purpose of the study was to determine the comparative effects of CD/manual combination versus the manual alone in terms of teacher and student outcomes. A posttest-only control-group design was used to determine the effects of the two methods of teacher instruction on teacher knowledge, implementation of the program, and quality of instruction. A pretest-posttest control-group design was used to compare teacher scores on their lecture-delivery methods. A pretest-posttest control group design was also used to determine the effects of the teachers’ instruction on student performance. Three types of analysis were used: a t-test, an analysis of covariance (ANCOVA), and the general linear mixed model (GLMM). All outcome (dependent) variables used in these analyses were treated as continuous variables. All analyses were conducted using a level of significance (alpha) of .05.
Results
The teachers’ implementation of the Taking Notes Together Program was measured in the classroom after they had read the manual or worked through the CD and the manual. The mean percentage of instructional steps implemented by the CD group was 97%; the mean percentage of steps implemented by the manual-only group was 87%. The posttest (after-training) scores of the two groups were compared using the general linear mixed model. A significant difference was revealed, F(1, 18) = 10.71, p = .0042, indicating that the CD/manual combination was more effective than the manual alone.
The quality of the teachers’ instruction was measured by observers using a checklist that listed the components of quality instruction. The HLM approach revealed a significant difference between the two groups of teachers, F (1, 18) = 14.42, p = .0013. The mean percentage of quality components was higher for the CD group (M = 90%) than for the manual-only group (M = 73%).
The quality of the teachers’ lectures was measured by observers using a checklist that corresponded to the instructions in the program on how to give a structured lecture. An ANCOVA revealed a significant difference between the CD group and manual-only group, F(1, 17) = 7.22, p = .016, with the CD group earning higher scores (M = 84%) than the manual group (M = 57%) after instruction.
The two groups of teachers also took a written test of their knowledge of the Taking Notes Together Program. A t-test revealed a significant difference between the mean scores of the groups, t(18) = 3.17, p = .005, with the CD group earning a statistically higher mean score (M = 94%) than the manual-only group (M = 81%). The effect size (d = 2.2) is considered to be very large according to the guidelines given by Cohen.
The CD group teachers completed a satisfaction questionnaire about the CD program. Their mean ratings on items on a 7-point Likert-type scale (with “7” indicating completely satisfied to “1” indicating completely dissatisfied) ranged from 6.2 to 6.8, with an overall mean rating of 6.7. Teachers in both groups completed a satisfaction questionnaire about the Taking Notes Together Program. The manual-only group had an overall mean rating of 6.45, and the CD group had an overall mean rating of 6.42.
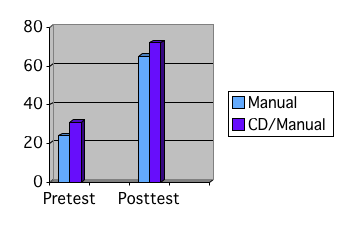
The students in the two groups of classes took a written test of their knowledge about taking notes. No differences were found between the groups at posttest. Both groups’ scores substantially improved from pretest to posttest, with the CD group students scoring higher (M = 72%) on the posttest than the manual-only group students (M = 65%). (See Figure 1 for mean scores.)
Figure 1. Mean pretest and posttest scores for the Student Knowledge Test
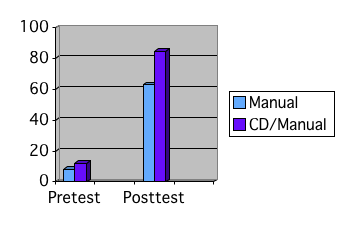
The students were asked to take notes from a short written passage before and after instruction. The general linear mixed model approach revealed a significant difference between the two groups of students’ posttest notetaking scores (after controlling for the pretest scores), F(1, 18.1) = 5.09, p = .0366, with the CD group students earning statistically higher scores (M = 85%) than the manual-only group students (M = 63%). (See Figure 2 for mean scores.)
Figure 2. Mean pretest and posttest scores for the Student Note-taking Activity
The students also completed a satisfaction questionnaire to indicate their satisfaction with the notetaking instruction provided by their teachers. The mean rating for the manual-only group students was 5.84 and for the CD group students was 5.7.
Conclusions
Working through the CD professional development program combined with reading the manual produced better results in terms of teacher implementation of the program than did reading the manual alone. This study showed that better implementation of a program is related to better student performance because the teachers who implemented the program at a higher level of quality (the CD group) produced better note-taking performance in their students. Teachers in the CD group were satisfied with the CD software program, and teachers in both groups were satisfied with the Taking Notes Together Program. Likewise, students in both groups were satisfied with the Taking Notes Together Program.
Reference
Vernon, D.S. (2006). Effects of a professional development software program for the Taking Notes Together program: Progress Report. SBIR Phase II # R44 HD41819. Washington, D.C.: National Institute of Child Health and Human Development.
Overview
The Talking Together Program is used to teach students how to participate in class discussions. The research was conducted in 20 third- and fourth-grade general education classes. These intact classes were randomly assigned to the experimental or comparison condition. A total of 377 students participated. The 10 teachers of the experimental classes taught their students using the Talking Together Program. The 10 comparison teachers did not use this program.
Results
Observational data were gathered on the fidelity of the experimental teachers’ implementation of the instruction. They presented a mean of 91% of the information in the Talking Together instructor’s manual.
All students in experimental and comparison classes completed a written test of their knowledge about participating in discussions and community building skills at pretest and posttest. An ANCOVA revealed a significant difference between the posttest scores of experimental and comparison students, F (1, 17) = 112.04, p < .001, η2 = .87, representing a very large effect size. (See Figure 1 for the mean scores.)
Data were also gathered on the students’ and teachers’ performances as they participated in class discussions. The ANCOVA for “yell outs” indicated a significant difference between the number of times students yelled out comments or answers between the two groups at the end of the study, F (1,17) = 53.381, p < .001, η2 = .76. The ANCOVA for “group responding” also showed a significant difference between the experimental and comparison groups, F (1, 17) = 9.386, p = .007, η2 = .356, indicating the number of times experimental students participated as a group during the discussion was significantly higher than in comparison classes. The ANCOVA for “partner responding” also showed a significant difference between groups, F (1, 17) = 7.282, p = .015, η2 = .300), indicating the number of times experimental and comparison students discussed answers with partners during the discussion was significantly different during the posttest. The ANCOVA for “negative comments” made by students also indicated a significant difference between the groups, F (1, 17) = 5.005, p = .039, η2 =. 227. Finally, related to teacher behavior, an ANCOVA showed a significant difference between the groups of experimental and comparison teachers for positive comments made by teachers during the posttest discussion, F (1, 17) = 4.864, p = .041, η2 = .222.
Data were also gathered on nine targeted students within each class with regard to such behaviors as raising their hands, waiting quietly to be called upon, and participating. The percentage of times that experimental target students raised their hands and either answered the question or lowered their hands when someone else answered increased from a mean of 14% before intervention to 72% while the mean remained about the same in comparison classes (15% at pretest and 14% at posttest). An ANCOVA indicated the difference between experimental and comparison groups during the posttest discussions was significant, F (1, 17) = 39.74, p < .001, η2 = .70. In addition, ANCOVAs indicated significant differences between experimental and comparison groups during the posttest observation for “yell outs” made by targeted students, F (1, 17) = 10.2, p = .005, η2 = .38, and for the number of participations in the discussion, F (1, 17) = 10.18, p = .005, η2 = .38. All of these differences represent large effect sizes in favor of the experimental classes.
Experimental teachers and students used a 7-point Likert-type scale to rate items regarding their satisfaction with the program (“7” indicating extremely satisfied; “1” indicating extremely dissatisfied) at the end of the year. Teachers endorsed the program, and their ratings indicated satisfaction with each aspect of the program. Their average overall rating of the program was 6.4. Students also indicated that they were satisfied with the program with a mean rating of 5.7.
Reference
Vernon, D.S. (2000). Effects of the Talking Together program: Progress summary. Washington, D.C.: National Institute of Child Health and Human Development, SBIR Phase II #1R44HD34306.
Overview
The Talking Together Program is used to teach students how to participate respectfully in discussions. To test the effects of a CD program versus a videotaped program for instructing teachers in how to teach the Talking Together Program, a study was conducted with 30 general education teachers who taught a total of 570 students in grades 4 and 5. The teachers were randomly selected into one of three groups. Ten teachers worked through the CD program and the instructor’s manual (hereafter referred to as the “CD group”) to learn how to teach the Talking Together Program. Ten teachers (hereafter referred to as the “video group”) watched the videotape and read the manual. Ten teachers (hereafter referred to as the “manual group”) read the instructor’s manual only.
The purpose of the study was to determine the comparative effects of CD/manual combination, the video/manual combination, and the manual alone in terms of teacher and student outcomes. A posttest-only control-group design was used to determine the effects of the two methods of teacher instruction on teacher knowledge, implementation of the program, and quality of instruction. A pretest-posttest control-group design was used to compare teacher scores on their lecture delivery methods. A pretest-posttest control-group design was also used to determine the effects of the teachers’ instruction on student performance. Three types of analysis were used: a t-test, an analysis of covariance (ANCOVA), and the general linear mixed model (GLMM). All outcome (dependent) variables used in these analyses were treated as continuous variables. All analyses were conducted using a level of significance (alpha) of .05.
Results
The teachers’ implementation of the Talking Together Program was measured in the classroom after they had read the manual or worked through the CD and the manual or watched the video and read the manual. The mean percentage of instructional steps implemented by the CD group was 91%; the mean percentage of steps implemented by the video group was 90%; and the mean percentage of steps implemented by the manual group was 88%. There were no statistical differences among the groups.
The quality of the teachers’ instruction was measured by observers using a checklist that listed the components of quality instruction. The general linear mixed model approach revealed a significant difference between the three groups of teachers, F (1, 27) = 3.78, p = .036. The mean score for the CD group (M = 94%) was significantly higher than the mean score for the video group (M = 78%) (p = .014). The mean score for the CD group also was significantly higher than the mean for the manual group (M = 82%) (p = .054), although this probability value is slightly less than the .05 alpha level needed for significance. The mean score for the manual group did not differ significantly from the mean score for the video group.
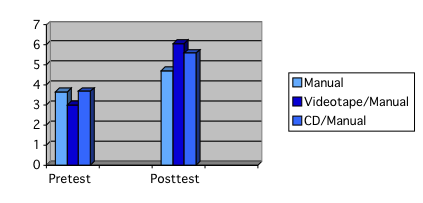
The teachers’ behavior related to engaging students in discussions, providing opportunities for low-risk participation in discussions, and providing compliments to students during discussions was measured by observers using a checklist that corresponded to the instructions in the program on how to lead a discussion. See Figure 1 for the average number of participations per student in discussions in the different class groups.
Figure 1. Average number of participations per student during the pretest and posttest
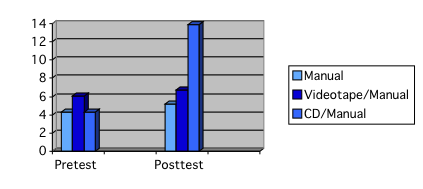
The mean number of compliments the teachers gave students during discussions are shown in Figure 2. An ANCOVA revealed a significant difference between the groups after instruction when the pre-instruction scores were used as the covariate, F(2, 25) = 3.74, p = .038. Follow-up tests revealed that the CD group gave more compliments than the manual group (p = .020) and the video group (p = .037).
Figure 2. Mean Number of Teacher Compliments during Class Discussions
The three groups of teachers also took a written test of their knowledge of the Talking Together Program. An ANOVA revealed a significant difference between the mean scores of the groups, F (2, 27) = 9.74, p = .001 Follow-up analyses revealed that the CD group earned statistically higher scores (M = 79%) than the manual group (M = 49%) and the video group (62%). No difference was found between the scores of the manual group and the video group.
The CD group teachers completed a satisfaction questionnaire about the CD program. Their mean ratings on items on a 7-point Likert-type scale (with “7” indicating completely satisfied to “1” indicating completely dissatisfied) ranged from 6.4 to 6.8, with an overall mean rating of 6.6. The video group teachers completed a satisfaction questionnaire about the video program. Their mean ratings on individual items ranged from 5.8 to 6.3, with an overall mean rating of 6.6.
Teachers in all three groups completed a satisfaction questionnaire about the Talking Together Program. The manual group had an overall mean rating of 6.1, the video group had an overall mean rating of 6.2, and the CD group had an overall mean rating of 6.5.
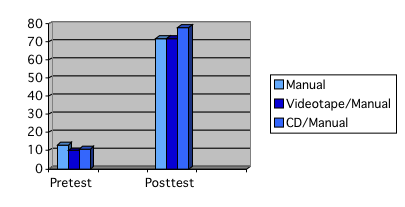
The students in the three groups of classes took a written test of their knowledge about participating in discussions. Although all the groups’ mean scores increased from pre-intervention to post-intervention, no differences were found between the groups at posttest. (See Figure 3 for mean scores).
Figure 3. Mean pretest and posttest scores for the Student Knowledge Survey
Conclusions
Working through the CD professional development program combined with reading the manual produced better results in terms of teacher knowledge, quality of instruction, proportion of students involved in discussions, and number of compliments given by the teachers than does reading the manual alone or watching a videotape and reading the manual. Teachers in the CD group were satisfied with the CD software program; teachers in the video group were satisfied with the video program; and teachers all three groups were equally satisfied with the Talking Together Program.
Reference
Vernon, D.S. (2004). Effects of a professional development software program for the Talking Together program: Progress Report. SBIR Phase II #R44HD41819. Washington, D.C.: National Institute of Child Health and Human Development.